
This was the exact challenge facing a top-tier client, let’s call them DigiBank. Weeks before a major launch, their app was technically flawless, but pilot users called it "confusing." They faced a costly dilemma: launch an app users already struggled with, or delay based on expensive guesswork. Our mission was to pinpoint the exact sources of user friction and provide a clear, actionable blueprint to fix them before launch.
Beyond Guesswork: Our Framework for Uncovering Ground Truth
- Simulate Reality, Not Hypotheticals: We don't ask what users would do. We create high-fidelity simulations and give them real-world tasks like 'Open a new savings account' or 'Transfer $50 to a friend.' This reveals the crucial difference between what people say and what they actually do when faced with a real interface.
- Identify the Exact Moments of Friction: As users perform tasks, our expert researchers pinpoint every hesitation, mis-click, and sigh of frustration. These are the moments, invisible on app analytics, that precede a customer abandoning a task, or your brand. We capture the user’s thought process to understand the "why" behind every struggle.
- Validate with Irrefutable Biometric Proof: This is where we go a crucial step further, moving from observation to objective proof. We use eye-tracking technology to see the app through your customers' eyes. Did they even notice the new feature? Did they read the critical error message? Eye-tracking removes all ambiguity, providing a visual record of the subconscious journey and revealing a level of truth that users themselves cannot articulate.

Eye tracking for testing the mobile apps
The Disconnect Between 'Bank Logic' and 'Human Logic'
Finding #1: Cognitive Overload is Crippling User Journeys
What We Recommended
- Strengthen the visual hierarchy immediately with larger menu icons, higher contrast, and a distinct background for the navigation bar. This is a high-impact, low-effort fix that reduces user friction overnight.
- Introduce AI-powered personalization to surface the user's most frequently used actions directly within the dashboard. By providing intelligent, contextual shortcuts, we reduce reliance on universal navigation and create a more efficient, intuitive user journey that drives engagement.
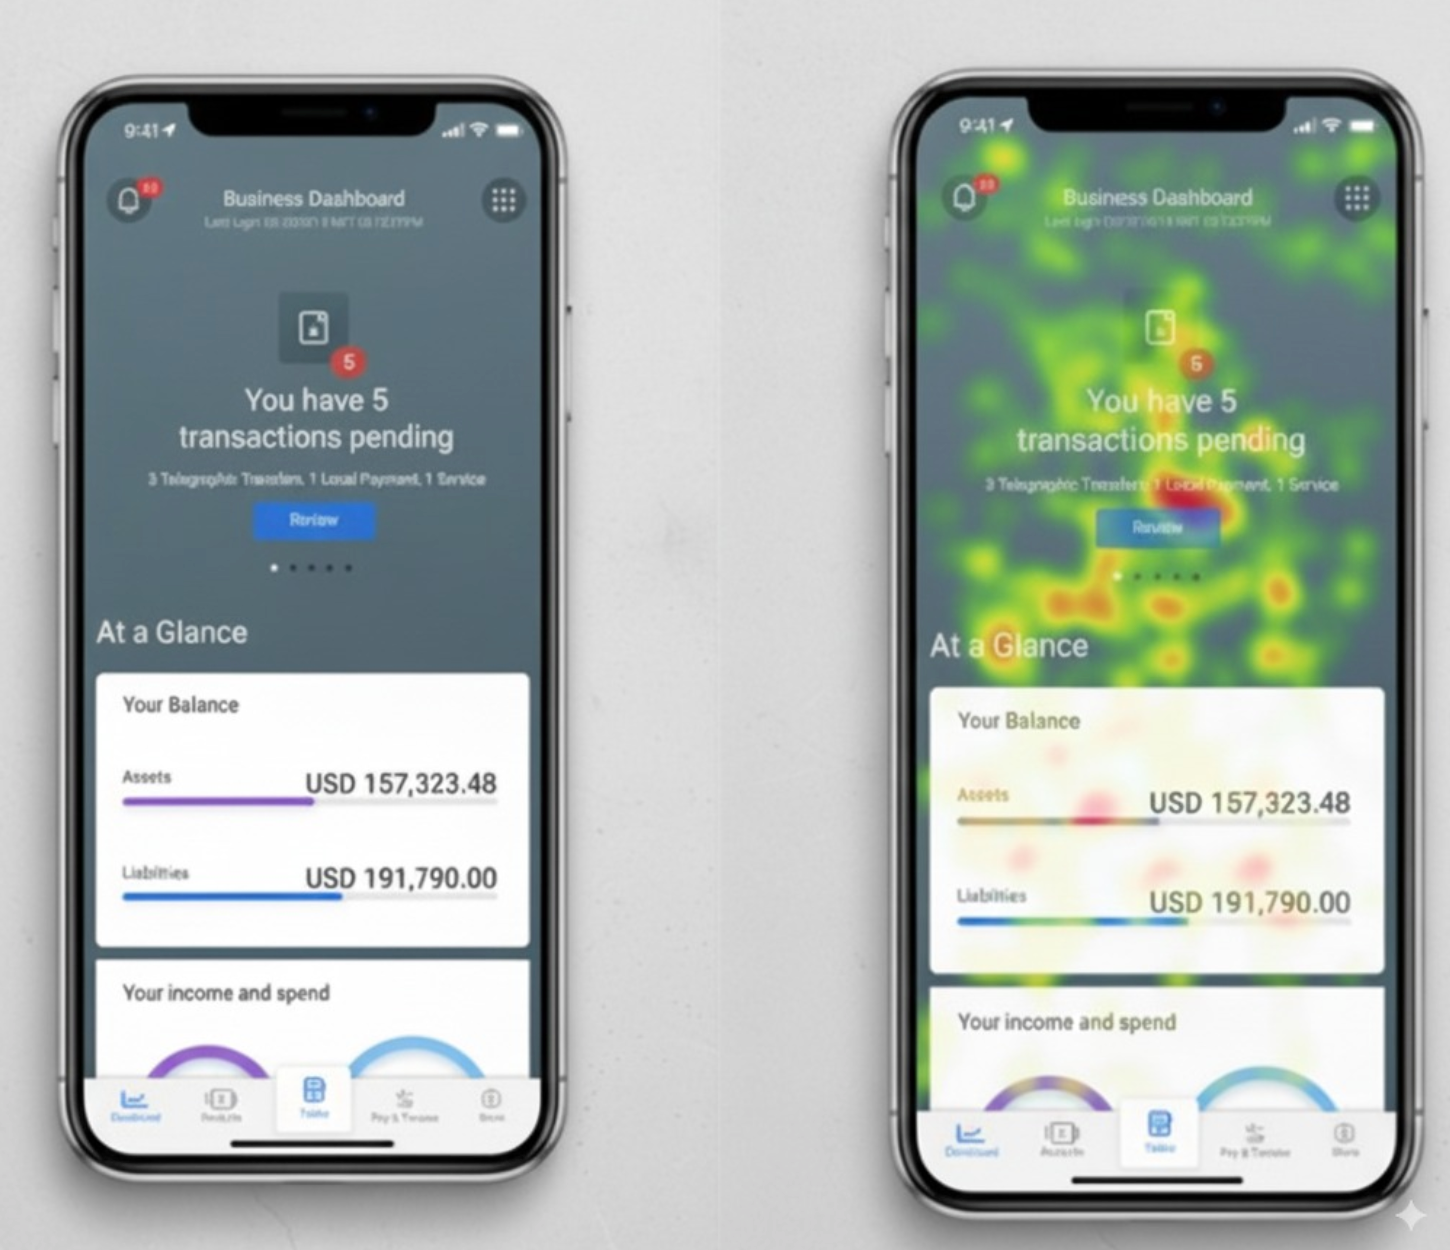
Heatmap of the focus areas
Finding #2: Complexity Overwhelms, Not Empowers
42% of users found the graphs difficult to comprehend. They reported non-intuitive color semantics (e.g., spend not being in red) and noted that the design prioritized aesthetics over clarity, requiring active effort to decipher rather than enabling at-a-glance understanding.
Furthermore, 45% of users, especially business owners, were stopped by unfamiliar jargon like “Working Capital” or “Cash Conversion Cycle” on the main dashboard. This language barrier completely negated the value of the insights being offered.
When users are overwhelmed by data, confused by visuals, or blocked by jargon, engagement plummets. They revert to manual, familiar processes, and a tool designed to be indispensable becomes unused.
What We Recommended
- Replace ambiguous visualizations with standard, purpose-built charts. Time-series data should use clear line charts with properly labeled axes, titles, and legends. Charts should be using semantically correct colors (e.g., red for spend) to intuitively reinforce meaning.
- Augment technical terms with clear, plain-language labels and optional tooltips. This respects the expertise of financial users while making the platform accessible and actionable for all stakeholders.
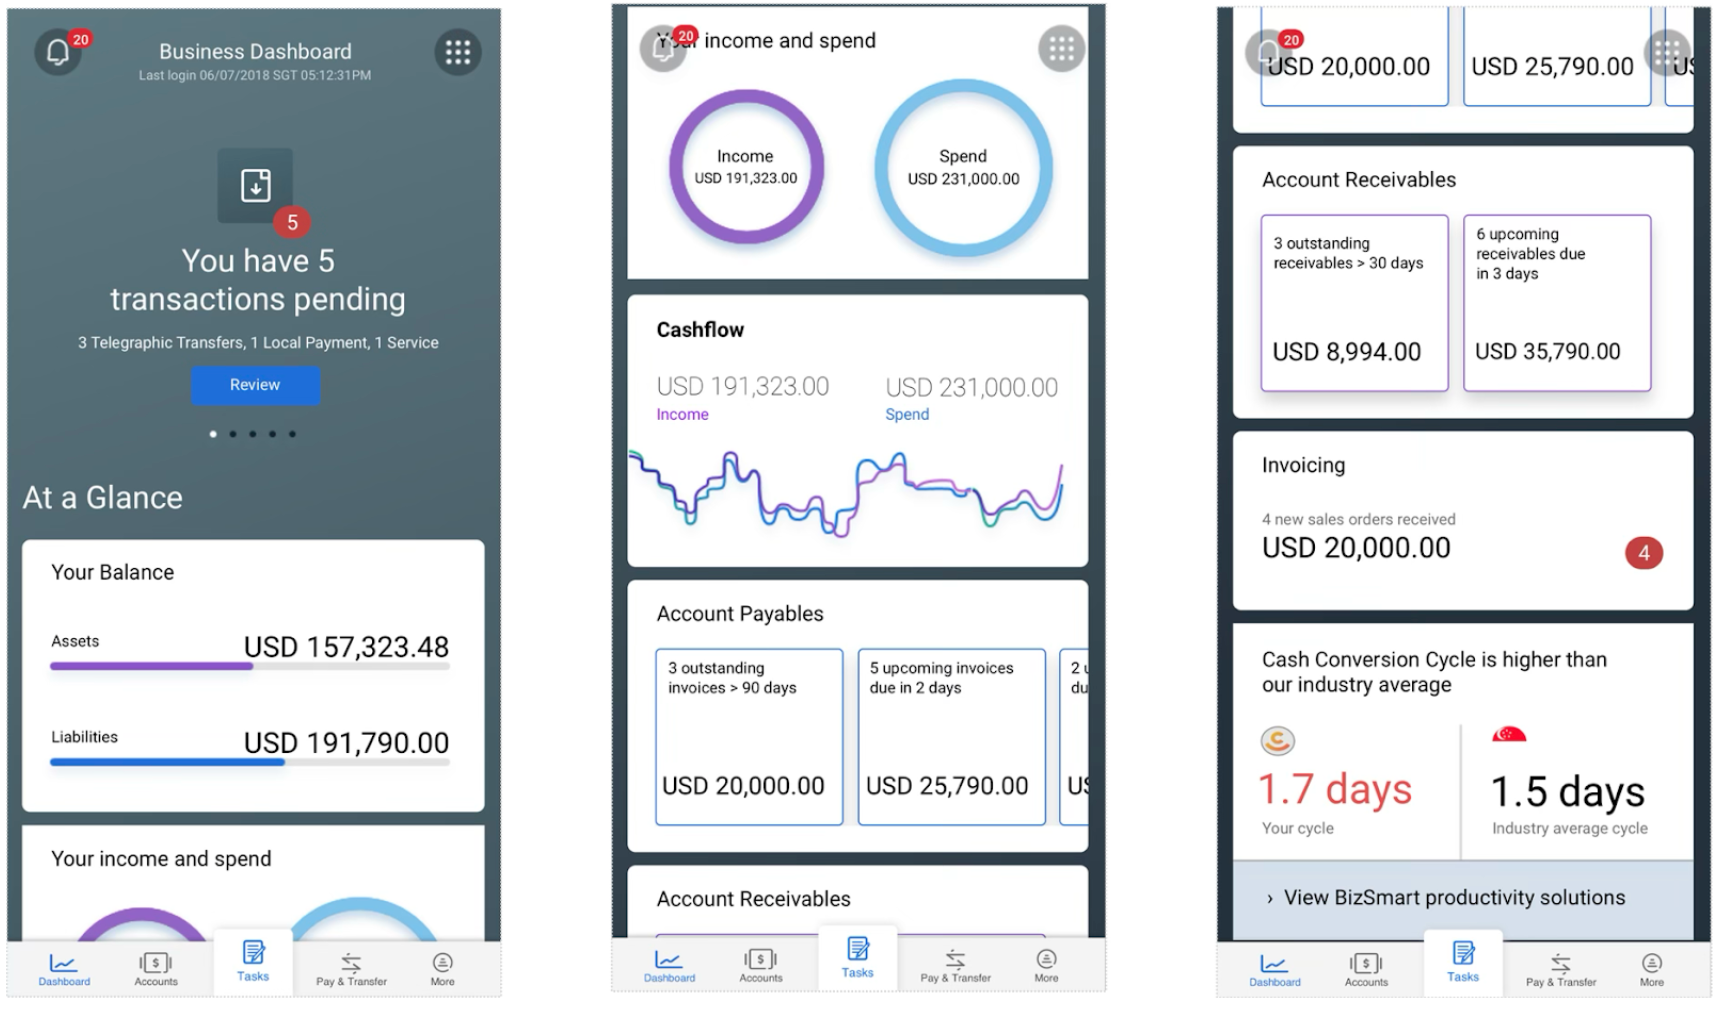
Complex Dashboards
Finding #3: More Features Don’t Equal More Value
- Minimize or remove non-core features like news and travel booking. This sharpens the user’s focus, streamlines the experience, and reinforces the app’s core value proposition.
- Rather than complicating the app, shift toward strategic integrations that enhance financial productivity. An AI assistant, for example, can deliver high-value functions, like personalized insights and financial news summaries, seamlessly within the existing environment. This boosts productivity without sacrificing clarity.
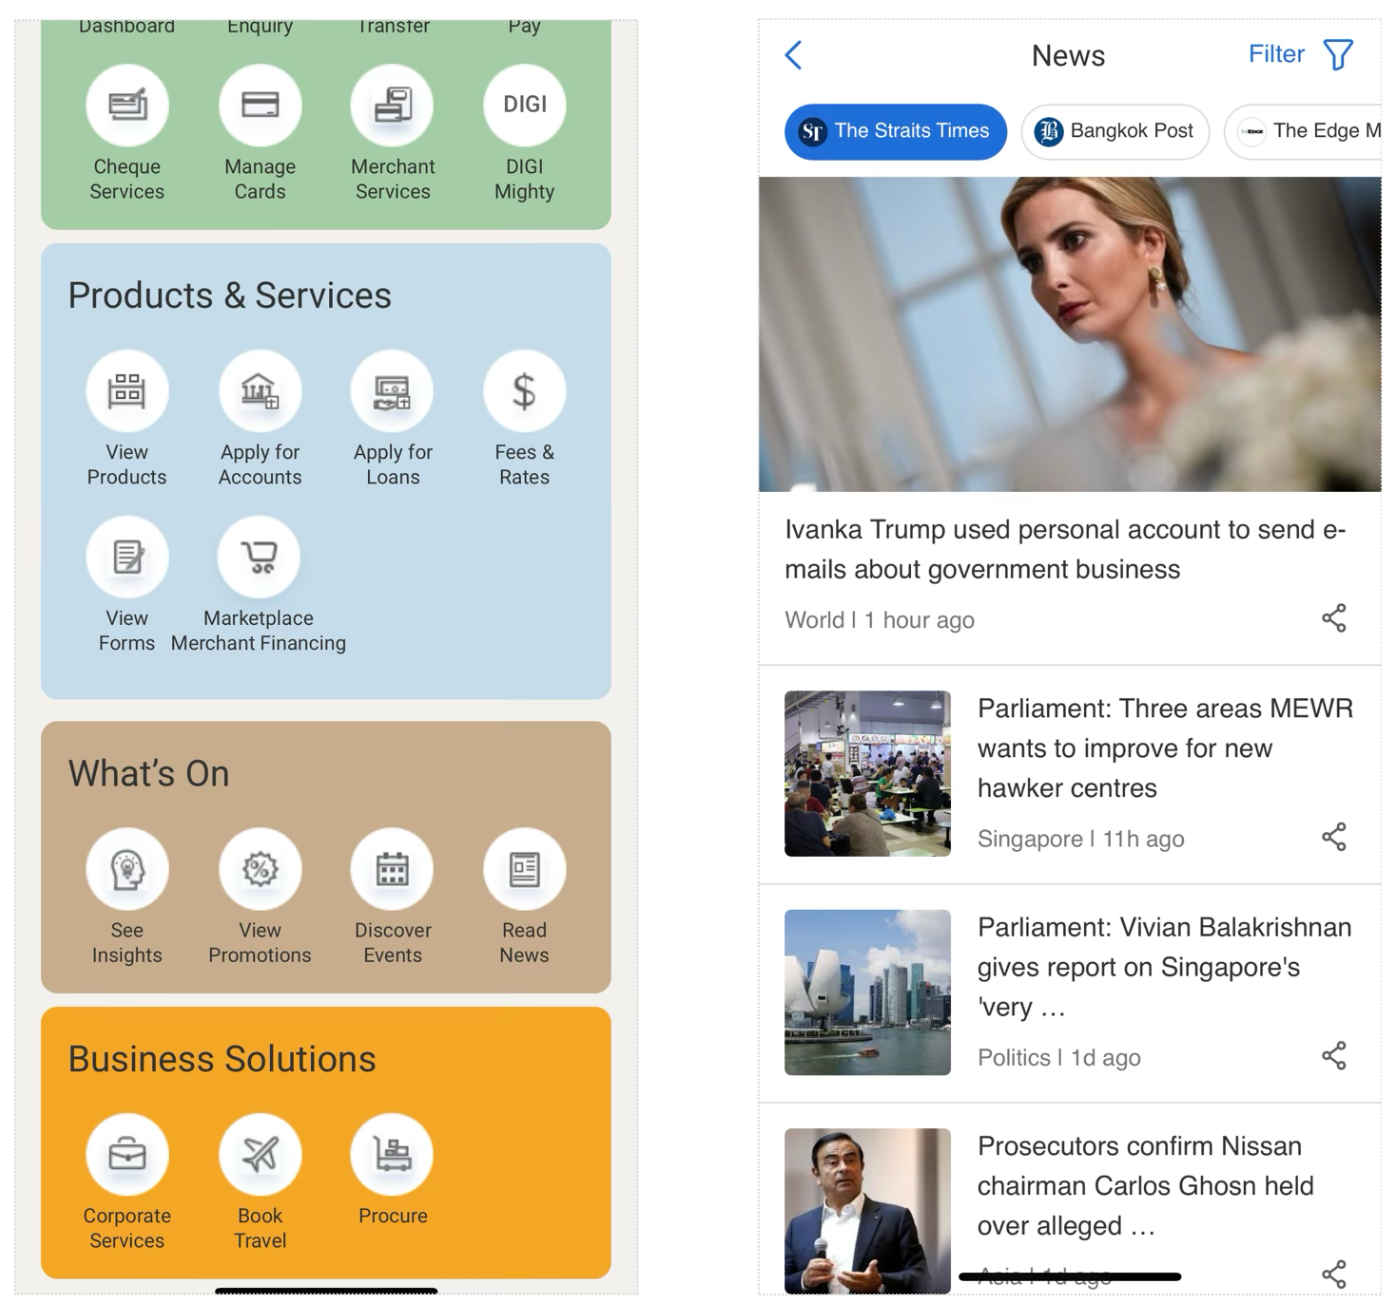
Segments and News
Outcomes: From Insight to Impact
The UX Science Score: A Before-and-After Snapshot
Our proprietary framework measures five core touchpoints on a 0-100 scale. The improvement was significant, with the overall score moving from 57 to 86 out of 100 post-launch.
|
Touchpoint |
Pre-Launch Score |
Post-Launch Score |
Change |
|
Usefulness (helps users achieve goals) |
58 |
88 |
+30 |
|
Usability (easy to learn and use) |
45 |
86 |
+41 |
|
Clarity & Copy (clear, helpful language) |
62 |
85 |
+23 |
|
Visual Design (aesthetically appealing) |
78 |
89 |
+11 |
|
Delight (enjoyable to use) |
40 |
80 |
+40 |
|
Overall UX Science Score |
57/100 |
86/100 |
The UX Science Score is powerfully validated by complementary user data:
- Net Promoter Score (NPS): 54 points, moving from detractors to passionate promoters.
- Reduced Confusion: Eye-tracking data showed a 40% reduction in time spent on "confusion hotspots.”
This multi-method validation, combining our clinical UX Science Score with user sentiment (NPS) and behavioral data provides a clear, data-backed view of the ROI, leaving no doubt about the value of a user-centric approach.